


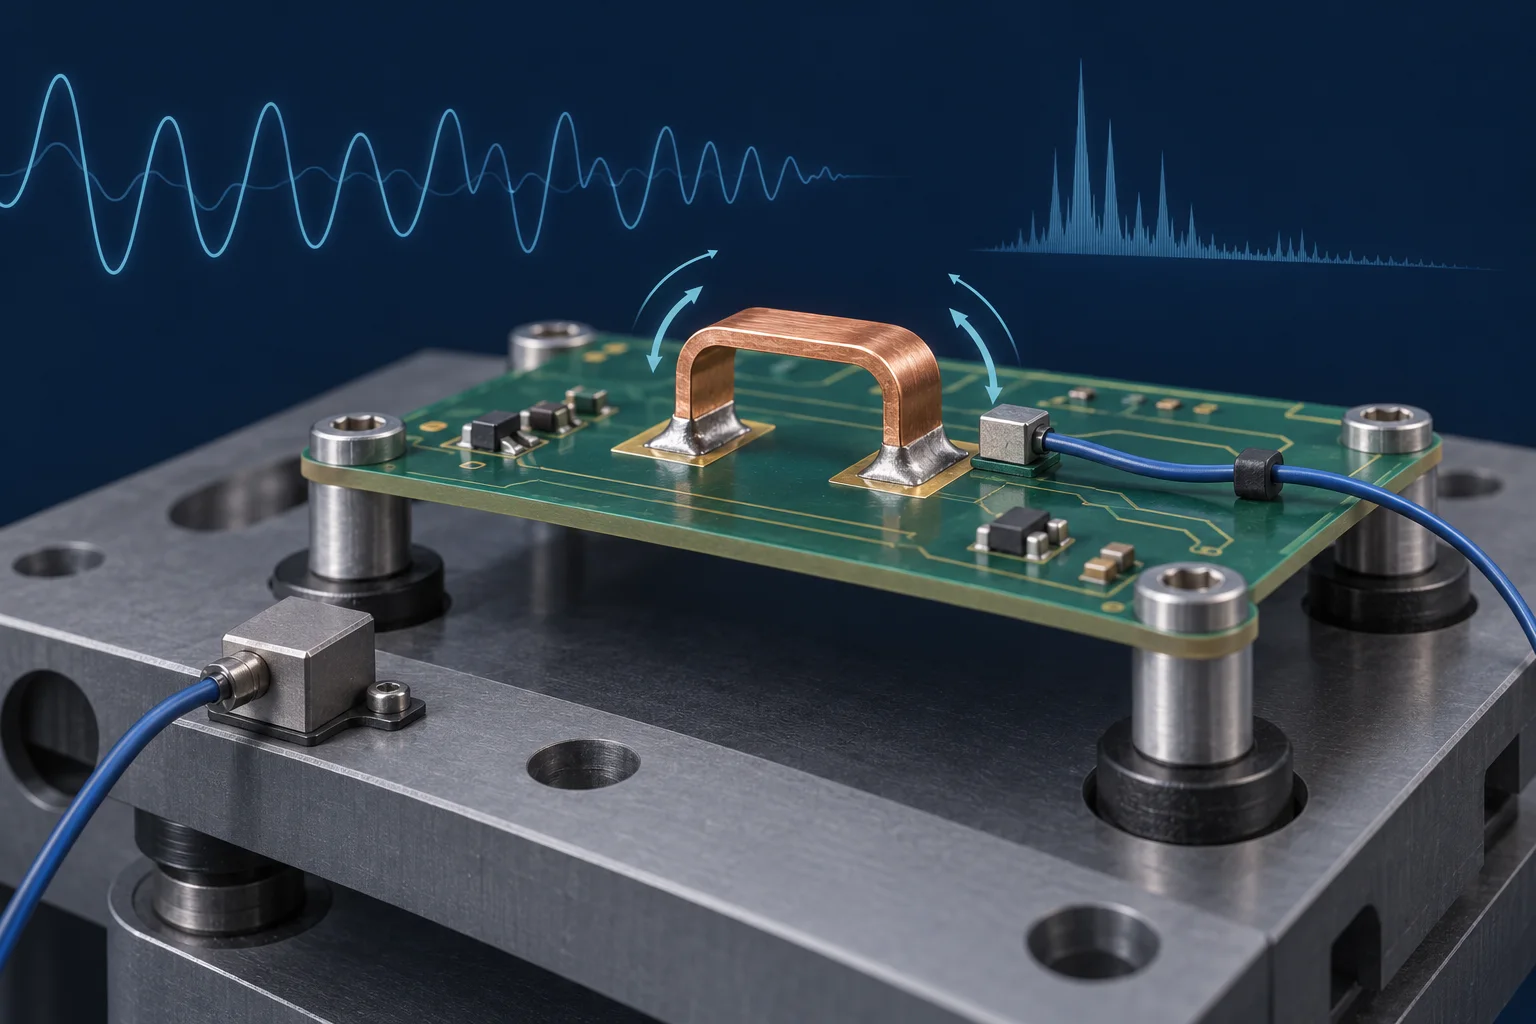
A surface mount PCB jumper random-vibration report needs more than Grms. Retain acceleration PSD, frequency band, axis, duration, fixtures and sensor locations. Equal overall RMS can accompany different spectral distribution and local PCB response, so a single g value does not establish equivalent tests.
Separate g from g²/Hz
Vibration Research's calculation guide obtains mean-square acceleration by integrating acceleration PSD over frequency, then takes its square root. For one-sided PSD Sa(f), arms = √[∫Sa(f)df]. PSD in g²/Hz integrates to g² and produces RMS in g, an acceleration unit rather than grams.
Assume an ideal one-sided PSD of 0.010 g²/Hz only from 100 to 200 Hz, with zero elsewhere. Mean square is 0.010 × (200 − 100) = 1.0 g², giving 1.0 Grms. Moving the same flat spectrum to 300–400 Hz preserves 1.0 Grms but changes the excitation band. This is arithmetic, not a jumper test specification.
| Record | Typical unit | Also specify |
|---|---|---|
| PSD | g²/Hz | Breakpoints, slopes, one-sided convention |
| Overall RMS | g rms | Integration band, axis, location |
| Time-domain peak | g peak | Record length, sampling, peak definition |
| Exposure | Minutes or hours | Time per axis, interruptions, specimen state |
Random RMS is not a sine peak
For an ideal sine, RMS equals peak divided by √2: 1.414 g peak is approximately 1.0 g rms. Random vibration has no single equivalent peak factor; distribution, record duration and control settings matter. A requirement stating only “1g vibration” needs clarification.
Control-point compliance is not local equivalence
Vibration Research's introduction describes closed-loop control at a specified location; that PSD does not directly establish forces everywhere on the specimen. For surface mount PCB jumpers, record board supports, orientation, fixture, neighboring components and sensors. Resonance can change local response; a table spectrum is not a solder-stress spectrum.
Distinguish control and response channels in the approved plan. Keep spectra and time histories, and inspect before/after using consistent electrical and visual criteria. Sensor mass and wires can affect a small board, so the test owner should approve their arrangement. There is no universal Grms acceptance level for every jumper assembly.
Common questions
Is higher Grms always more severe? Spectral shape, duration, axis and structural response also matter.
Does vibration testing replace depaneling checks? No. Depaneling imposes a different manufacturing load; see PCB depaneling strain validation.
Cover is an AI vibration-test illustration, not Hongchuan equipment, measured spectra or qualification evidence. Calculations are not vibration ratings or life commitments.