


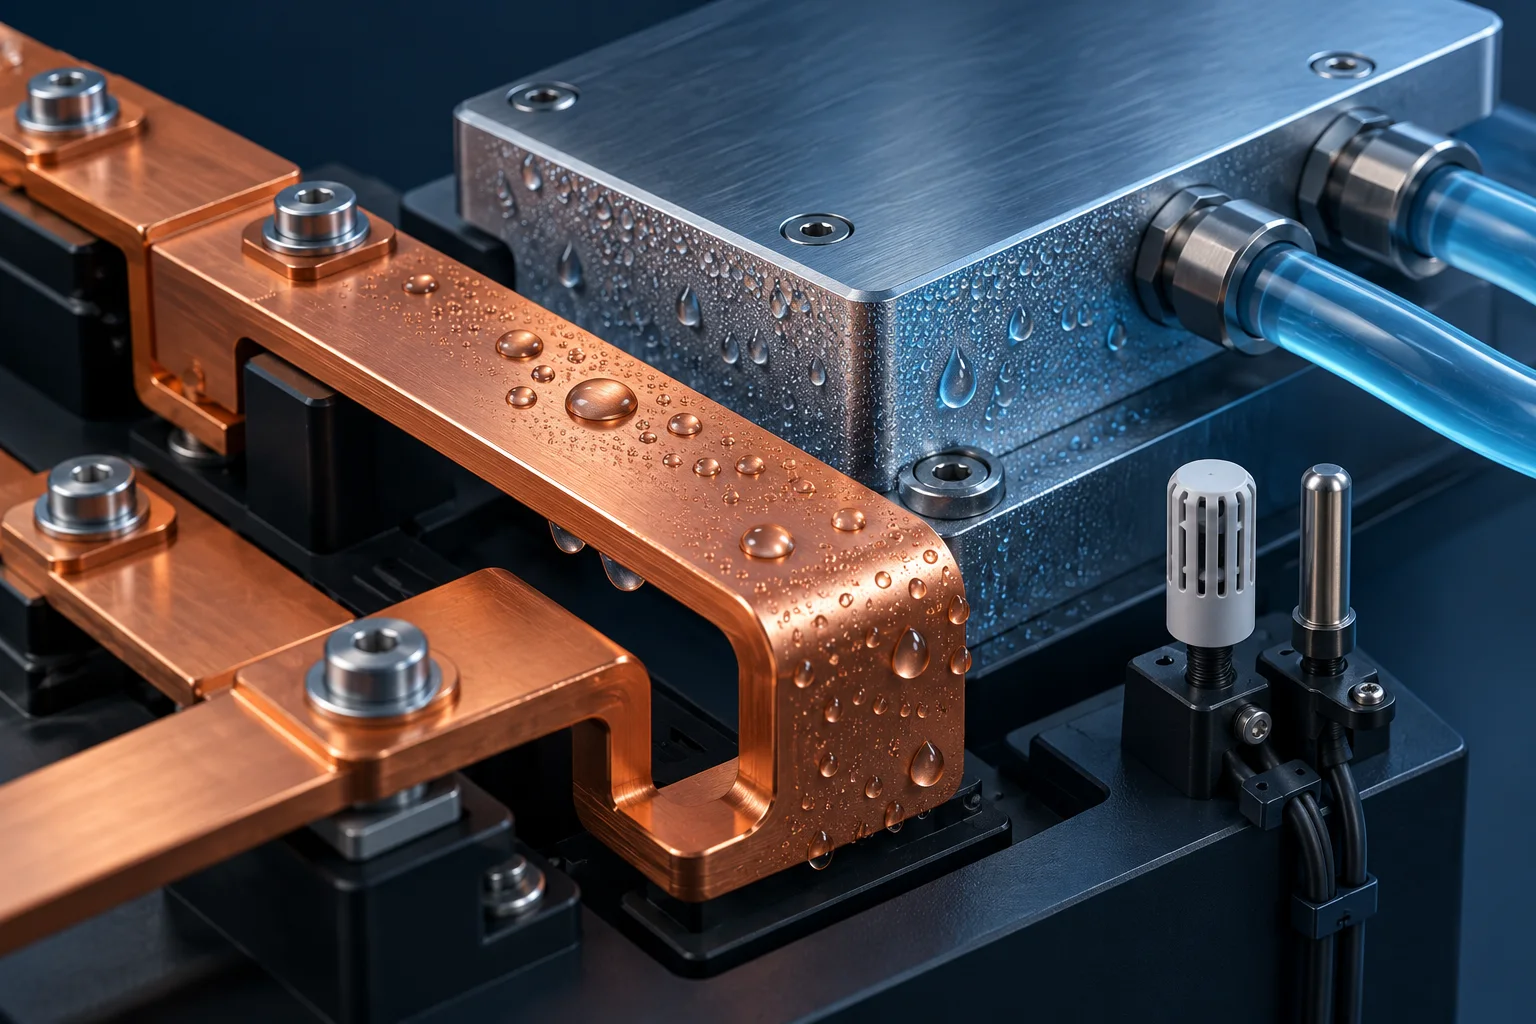
To assess condensation near a liquid-cooled PCB busbar, compare local air dew point Td with metal surface temperature Ts. A surface approaching or falling below the dew point requires investigation. Coolant temperature, cabinet-average humidity and energized busbar temperature rise cannot independently establish whether condensation is controlled.
Locate the air measurement before interpreting dew point
The Vaisala DM500 user guide explains dew point in relation to condensation and distinguishes frost point below freezing. This guide concerns liquid-water condensation around PCB copper busbars and their insulation, not an equipment certification or a universal environmental rating.
Measure representative air near the surface under investigation, away from a hot-air jet or a clearly different microclimate. Record probe position, air temperature in °C, relative humidity in %RH, pressure conditions and the instrument's dew-point calculation method. A sensor beside the cabinet door may not represent air touching a cold-plate edge.
Keep four temperature records separate
| Quantity | Purpose | Possible omission |
|---|---|---|
| Local dew point Td | Identify the condensation threshold for that air | Humid air entering during maintenance |
| Surface temperature Ts | Compare the target with dew point | Cold screws, supports and insulation edges |
| Coolant temperature | Describe the cooling boundary | Different metal surfaces have different temperatures |
| Nearby air temperature | Input to humidity interpretation and thermal records | Localized heating shifts a probe reading |
Use a temperature difference without inventing a universal margin
Define ΔT=Ts−Td in K. A temperature difference has the same numerical value in °C. For a hypothetical instrument-reported dew point of 24 °C and simultaneous surface temperature of 22 °C, ΔT=−2 K. This flags a condition requiring investigation. The dew point is an assumed input, not a calculation from an unspecified humidity pair or a Hongchuan measurement.
A slightly positive result still requires allowance for uncertainty, response time and unmeasured cold spots. Set any control margin through equipment-level risk assessment and measurement capability. Retain synchronized traces rather than combining a minimum surface temperature from one period with an average dew point from another.
Include shutdown and maintenance conditions
Vaisala's guidance on condensing environments notes that probe cooling and rapid process changes can also produce condensation on the instrument. A risk-based test should therefore consider startup, operation, shutdown with continued coolant flow, humidity changes and enclosure opening. Check whether the humidity probe is wet or recovering.
Qualified personnel must plan sensor installation and acquisition using an approved electrical safety procedure. Do not attach a grounded probe to an energized high-voltage busbar or create live condensation demonstrations. Follow the approved shutdown process if water films, insulation abnormalities or invalid measurements appear.
Information for a design or purchasing review
Provide the PCB busbar supplier with cold-plate location, exposed-metal geometry, environmental range, coolant controls and installation drawings. Review whether insulation, sealing, dehumidification or control changes also affect cooling and maintenance. For surface measurements, see infrared emissivity and reflection on copper busbars.
Questions
Does relative humidity below 100% prevent condensation? Not necessarily. The air probe and metal surface may be at different temperatures; compare local dew point with the actual surface.
Is the absence of visible droplets sufficient? No. Include transient and shutdown conditions and equipment-level insulation checks. Visual inspection alone does not establish acceptance.
The cover is an AI-generated condensation concept, not a Hongchuan product photograph or test record. The example explains a temperature difference and is not an acceptance limit.