


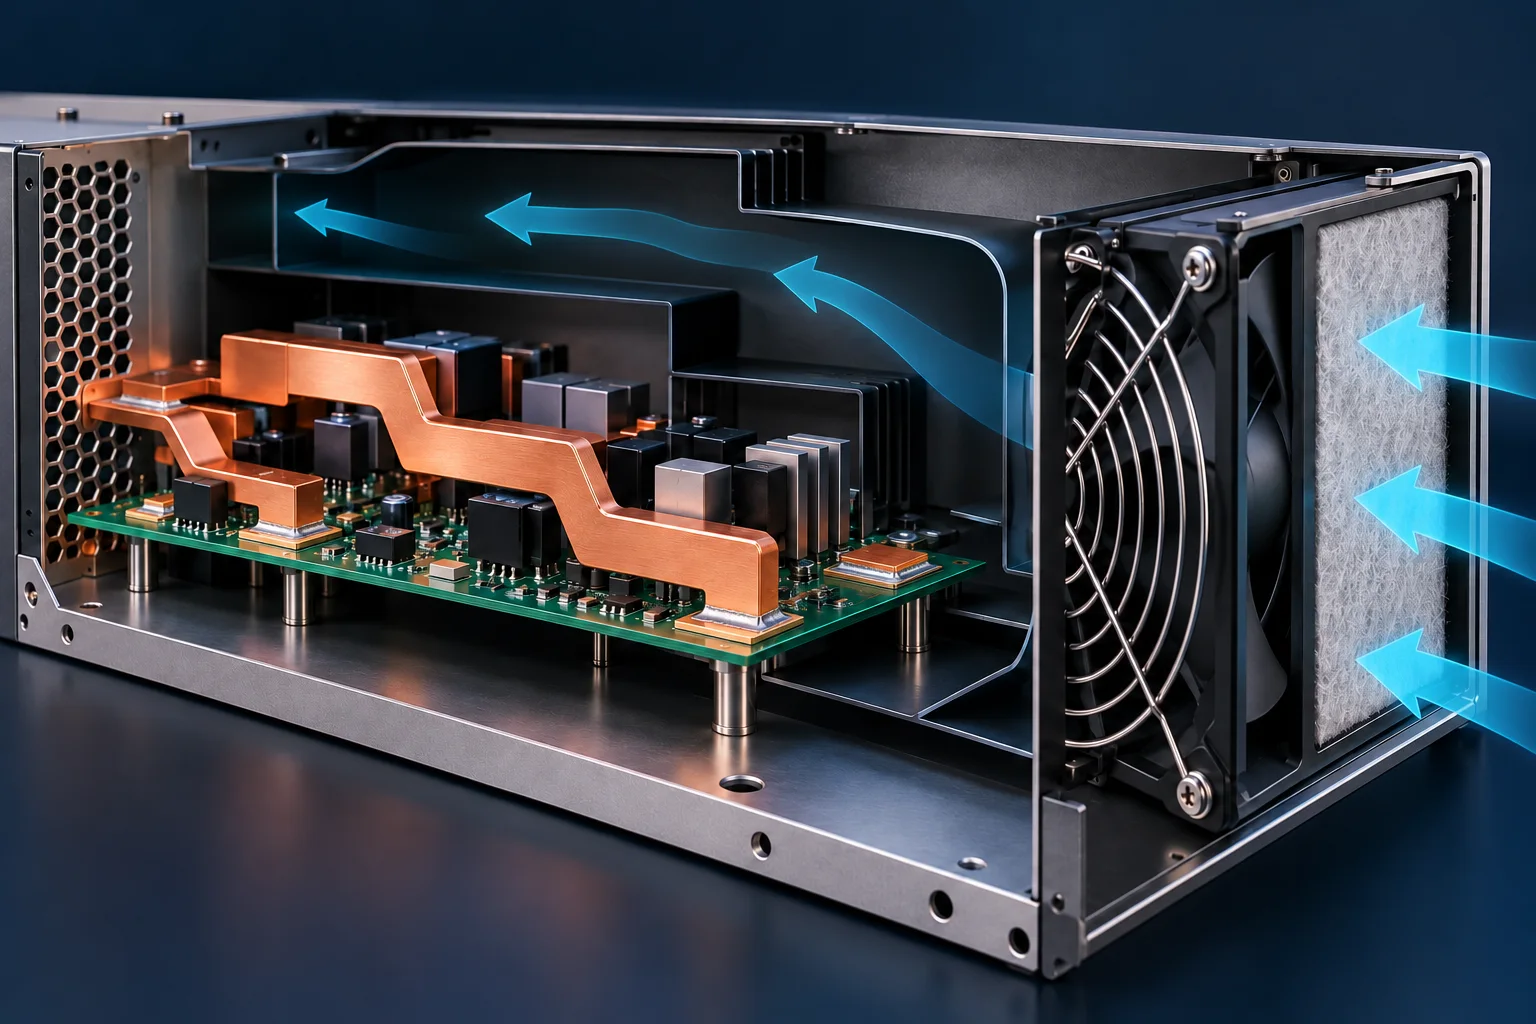
A cooling record for an SMD busbar should identify the installed air path, fan operation and temperature locations. Catalog maximum airflow is not installed airflow or busbar surface velocity. Review fan P/Q and system-resistance curves, then verify temperature in the actual assembly.
Identify the point on the curve
Noctua's public P/Q comparison and multi-fan guide distinguish maximum airflow, maximum static pressure and application operating points. Maximum flow occurs near zero pressure difference; maximum static pressure occurs near zero flow. The two maxima are not one simultaneous operating condition.
The intersection of fan and system-resistance curves helps evaluate operating flow. A fan with greater maximum airflow does not necessarily deliver more air in the same restrictive enclosure. Compare curves under the relevant speed, supply and test conditions.
| Record | Units or contents | Avoid |
|---|---|---|
| Volume flow Q | m³/s, m³/h or CFM | Reporting it directly as local m/s |
| Static pressure difference | Pa and curve definition | Combining maximum pressure with maximum flow |
| Fan operation | Model, speed, supply, control | Recording duty cycle without actual speed |
| Installed geometry | Filter, duct, openings, component layout | Reusing a thermal result after geometry changes |
Flow-to-velocity conversion needs a cross-section
Assume actual net flow through a section is 0.012 m³/s, or 43.2 m³/h, through 0.004 m² with approximately uniform normal flow. Mean velocity is Q/A=3 m/s. This hypothetical section calculation does not justify dividing catalog fan flow by busbar area to obtain surface velocity.
Bypass, recirculation and obstructions can create different local conditions. One high-velocity location does not establish equal cooling at all joints. Record measurement positions, directions and methods, and distinguish complete-assembly measurements from separate duct data.
Compare cooling changes consistently
For PCB SMD busbars, retain the PCB revision, load, ambient reference and temperature locations when comparing fan or duct changes. Record covers, filters, harness routing and adjacent heat sources. Actual temperatures and approved criteria determine acceptability, not catalog fan maxima.
Thermal pads and contact resistance concern conduction paths. This page concerns the cooling environment. Neither alone establishes a busbar current rating.
Questions
Can a faster fan use the previous thermal report automatically? Review the actual operating point and assembly conditions and perform required revalidation.
Do two fans double installed flow? Series/parallel arrangement and system resistance matter; catalog values cannot simply be added.
References
Noctua P/Q and application operating points; Noctua multi-fan and system-resistance guide.
Cover is an AI-generated airflow concept, not Hongchuan thermal test evidence. Hypothetical flow and velocity values provide no cooling or current rating.