


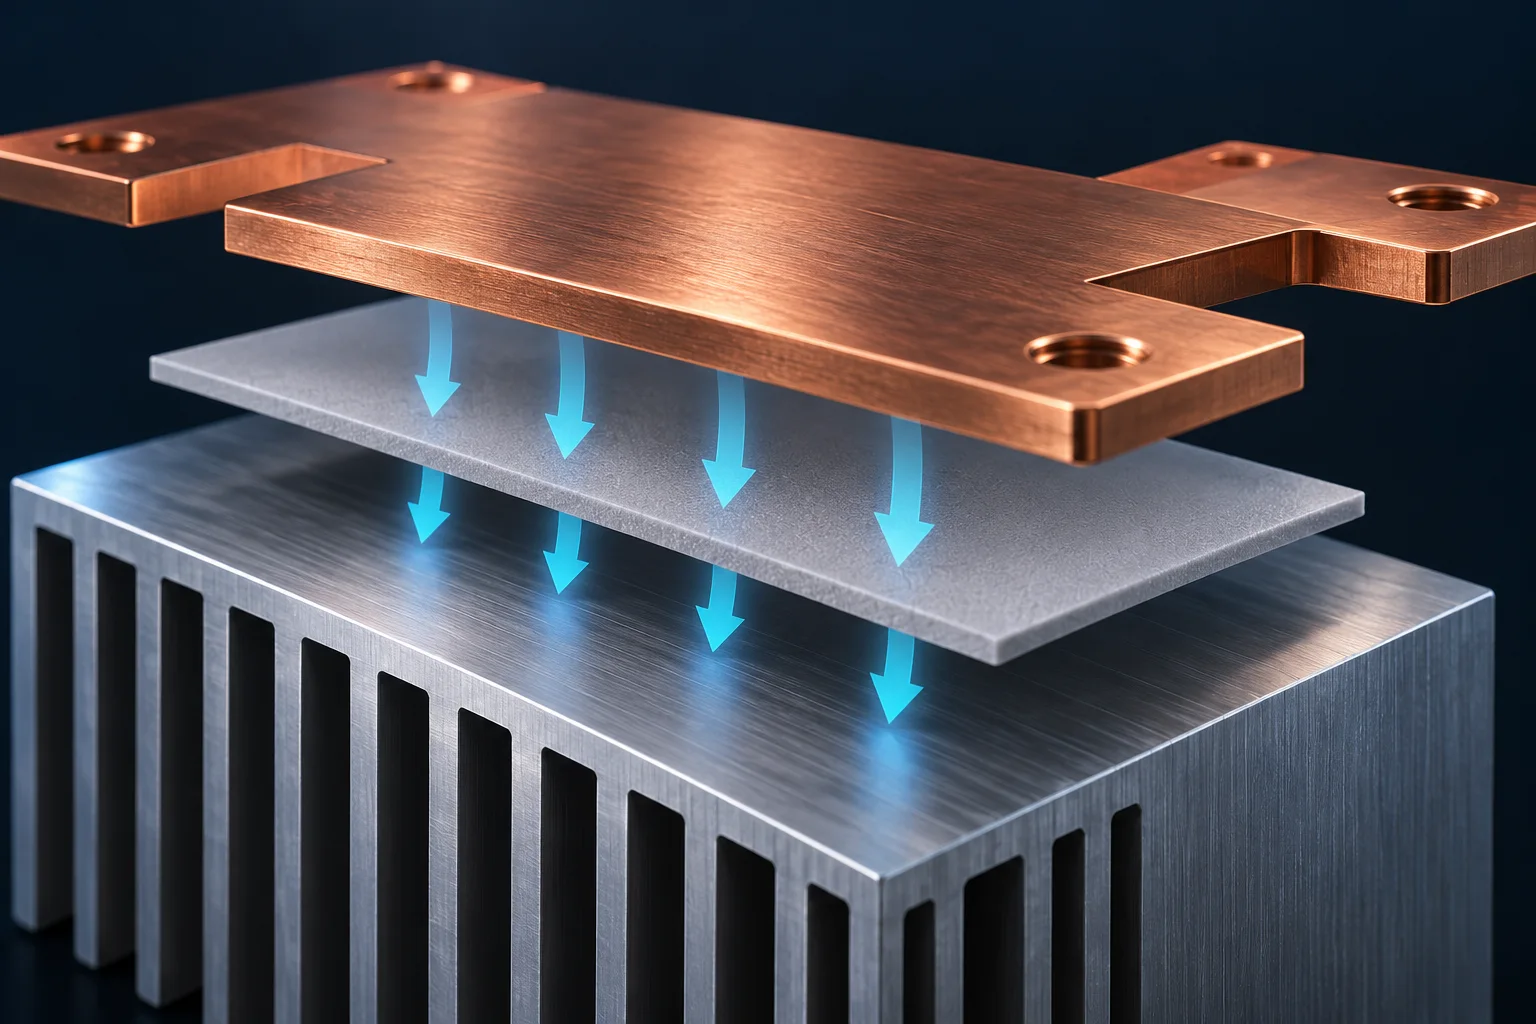
A thermal pad can help cool a PCB busbar only when it forms an effective heat path. Conductivity k, in W/(m·K), is different from thermal resistance in K/W. A higher k alone cannot predict the busbar temperature reduction; installed thickness, contact area, interfaces and the heat sink-to-ambient path also matter.
Calculate the temperature difference across the pad
The OpenStax plane-wall conduction relation gives Rmaterial=t/(kA). Use thickness t in metres along the heat-flow direction and area A in m² normal to that direction. This is a homogeneous, one-dimensional steady-state model, excluding interface resistance and lateral spreading.
Assume an installed thickness of 1.0 mm, k=3 W/(m·K), and effective area A=200 mm². Then Rmaterial=0.001/(3×0.0002), approximately 1.67 K/W. If 3 W actually flows through this material, its face-to-face temperature difference is approximately 5 K. This is neither the busbar rise above ambient nor a promise that adding the pad reduces temperature by 5°C.
| Review item | Units or record | Purpose |
|---|---|---|
| Conductivity k | W/(m·K), direction and method | Material heat-transfer property |
| Installed thickness t | mm at stated compression | Actual conduction distance |
| Effective area A | mm² and contact location | May differ from overall pad area |
| Interfaces and cooling path | Pressure, surfaces, sink and airflow | Resistance outside the pad material |
Check the units in supplier data
Parker distinguishes material conduction from contact resistance and identifies pressure, surface condition and thickness as relevant factors. Area-normalized values such as K·cm²/W cannot be compared directly with K/W. Conversion requires a consistent area definition and compatible test conditions.
Request data for the relevant thickness and pressure, stating whether interfaces are included. Do not combine an uncompressed nominal thickness with thermal data measured at a different pressure. Incomplete contact can make a nominal-area calculation optimistic.
Record the assembly conditions
Compare PCB busbar cooling options with the same PCB, measured current, temperature locations, ambient conditions and airflow. Record pad installation and pressure. Have mechanical loading reviewed before increasing clamping force. Thermal conductivity does not establish electrical insulation suitability.
Busbar thermal time constants address transient recording. The calculation here concerns a steady-state material temperature difference.
Questions
Does doubling k halve busbar temperature rise? It halves only this ideal material-resistance term with all other inputs unchanged.
Is a thicker pad always worse? Its ideal bulk resistance increases, but gap filling, contact and mechanical constraints must also be satisfied.
References
OpenStax conduction relation; Parker thermal interface properties.
Cover is an AI-generated heat-path illustration, not Hongchuan test evidence. Hypothetical calculations do not specify product resistance, temperature rise or electrical insulation.