


A small temperature rise during a short SMD busbar test does not establish long-term acceptance. Record temperature versus time, actual current and segment voltage, and use the project's defined thermal-stability criterion. A thermal time constant belongs to the actual PCB and mounting/cooling conditions.
State the model assumptions
Nexperia's RC thermal note explains transient modelling for semiconductor examples. Its device parameters must not be assigned to a copper busbar. Here a hypothetical single-node, constant-power model illustrates the difference between early and final heating.
Starting at a stable ambient temperature, ΔT(t) = P × Rth × [1 − exp(−t/τ)], with τ = Rth × Cth. Units are W, K/W, J/K and seconds respectively. The model assumes approximately unchanged ambient, heat path and parameters; it does not describe every location on a board.
| Elapsed time | Fraction of final rise | Meaning |
|---|---|---|
| 1τ | Approximately 63.2% | Substantial heating remains |
| 3τ | Approximately 95.0% | Near the model's final value |
| 5τ | Approximately 99.3% | Not a universal test-duration rule |
A hypothetical 30 K final rise
With P = 5 W, Rth = 6 K/W and Cth = 20 J/K, τ = 120 s and the model's final rise is 30 K. It predicts approximately 11.8 K after 60 s, 19.0 K after 120 s and 28.5 K after 360 s. These are calculations, not HC measurements or a six-minute test prescription.
Constant current does not ensure constant dissipated power. If resistance or contact condition changes, record P(t) = I(t) × Vsegment(t). Significant power variation invalidates direct use of the constant-power expression for the full trace; consider an appropriate variable-power or multi-node method.
Separate sensor response from specimen response
Murata's thermistor explanation derives the 63.2% response definition for a sensor. That is not a busbar time constant. Save attachment material, position and sampling method so sensor lag is not attributed entirely to the specimen.
For an SMD busbar, record the body, joints and PCB exit separately, along with ambient reference, airflow, board thickness/copper, cables, restraint and nearby heat sources. Preserve differences among the traces rather than reporting only the hottest image pixel.
Link the trace to the load history
RMS and pulse-duration calculations address another part of the load assessment. Time-domain thermal evidence does not replace peak-current, protection or insulation review. State the fit's operating condition, time range and residuals; retain raw data if a single-node fit is unsuitable.
Frequently asked questions
Can one fitted τ set the wait time for an entire family?No. PCB, installation and cooling changes need actual verification.
Does reaching 5τ prove acceptance?No. It is a model response proportion. Actual temperatures and project limits still govern.
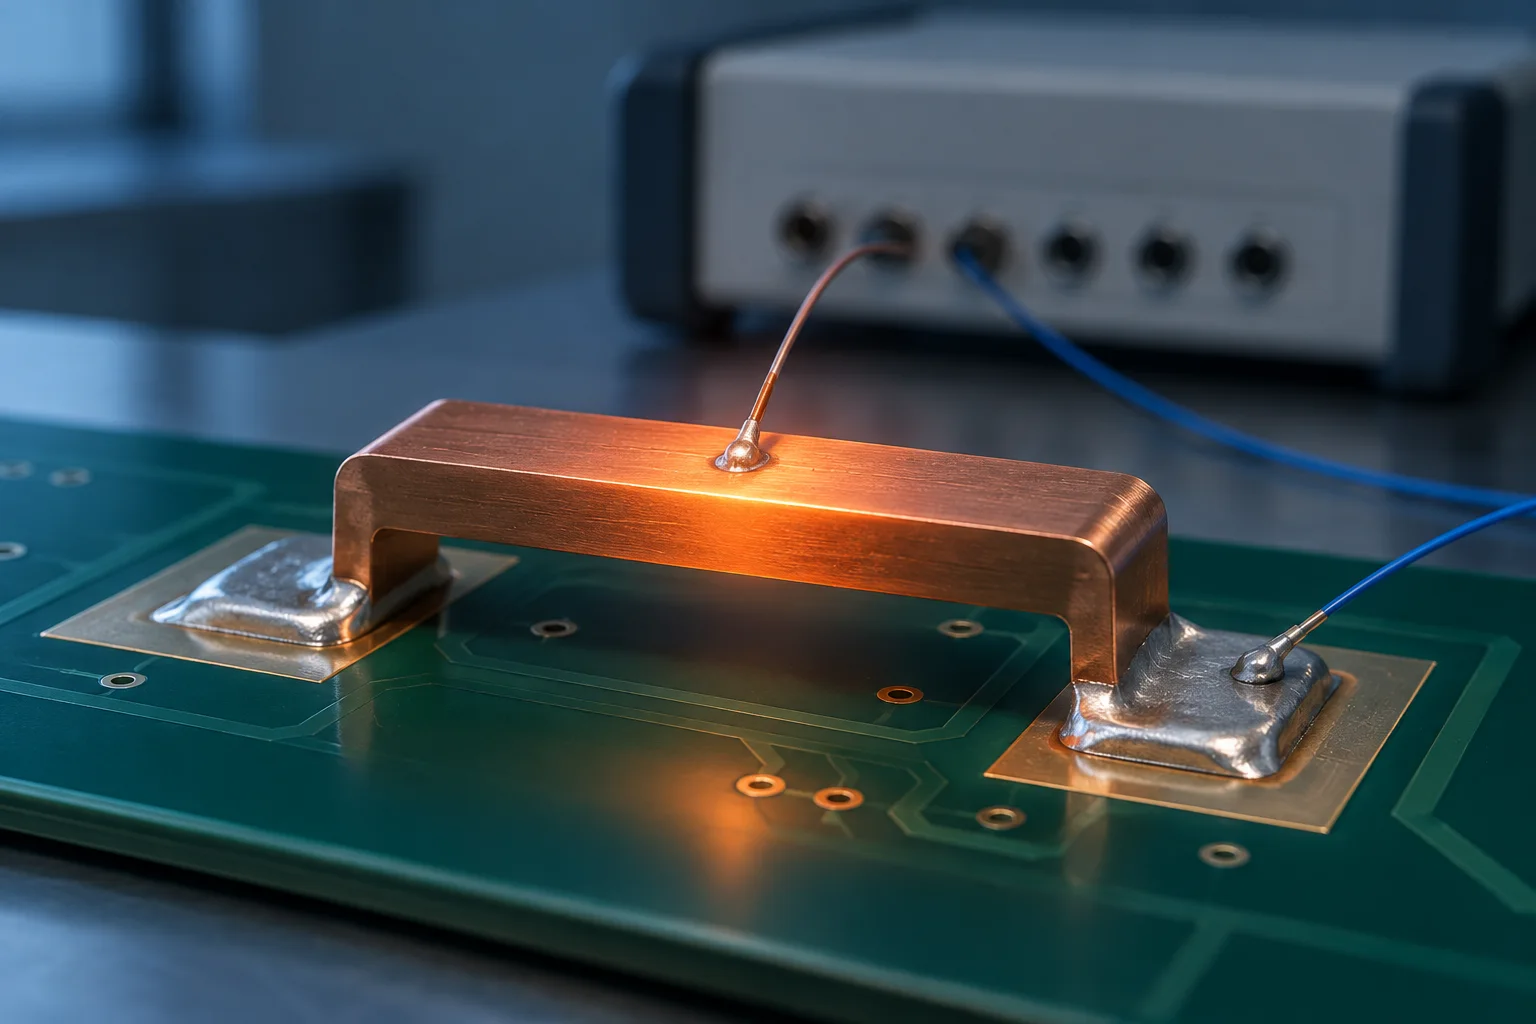
The cover is an AI-generated engineering illustration, not an HC product photograph, equipment or test record. Hypothetical calculations are not product specifications, ratings or acceptance commitments.