


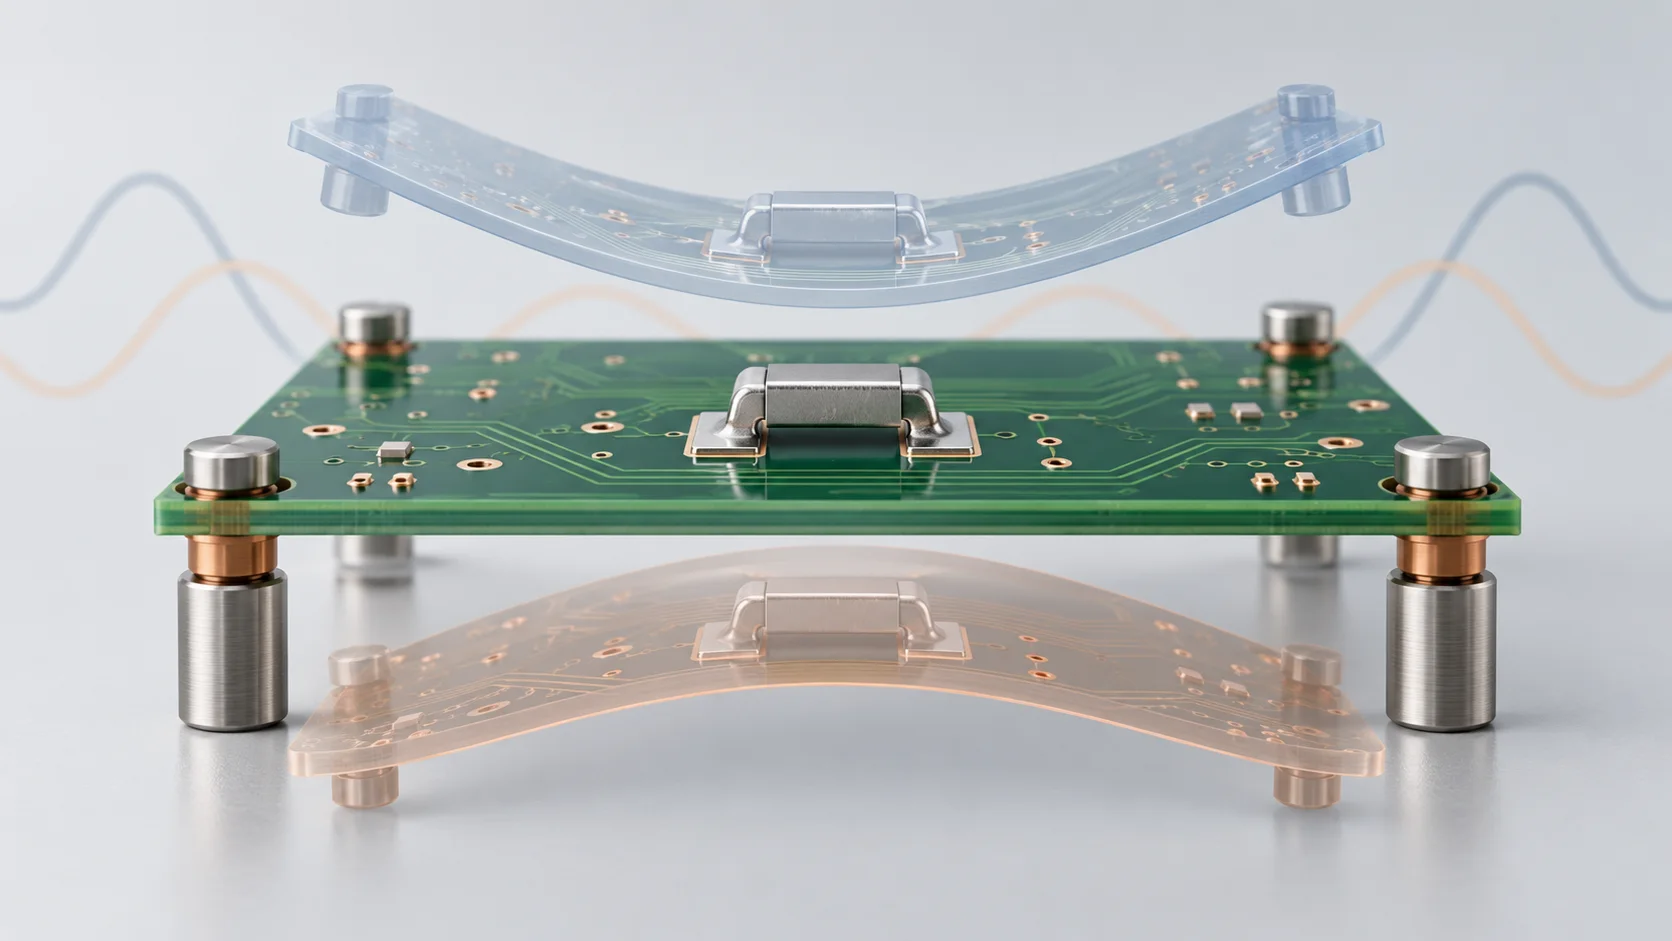
A displacement value of 1 in a surface mount PCB jumper modal plot cannot automatically be read as 1 mm of actual vibration. Mode shapes are scaled using a stated normalization convention. Actual amplitudes require a response analysis or measurement with defined loading, damping and boundaries.
Identify the normalization convention
An Autodesk Nastran training example sets the maximum eigenvector value to 1 and warns that displayed deformations are not actual vibration amplitudes. Ansys describes mass normalization in its Discovery PCB example. These differ, so maximum-equals-one is not a universal software rule.
As an illustrative maximum-component-normalized case, like-direction components of 1.0 and 0.5 describe a relative ratio within that shape. They supply neither excitation magnitude nor physical displacement. These illustrative values are not Hongchuan jumper results.
| Result | Retain | Does not independently provide |
|---|---|---|
| Natural frequency | Hz, mode and model | Vibration rating or life |
| Mode shape | Normalization and component definition | Actual displacement or stress amplitude |
| Response analysis | Load, frequency, damping and output units | Conformity outside the studied conditions |
| Measured response | Location, sensors and input conditions | Every solder-joint local stress |
Do not judge amplitude from an animation
Postprocessing may exaggerate deformation for visibility. For a surface mount PCB jumper, review display scale, result field and normalization before interpreting motion. A large animated excursion alone cannot establish clearance loss or solder-joint failure.
The Ansys example explains that actual response combines modal contributions. To assess displacement or joint loading, use an appropriate response method with excitation direction, frequency range, damping and installed boundaries. A natural frequency near an excitation deserves investigation, but proximity alone does not prove failure.
Retain the installed model
A useful report includes PCB revision, support locations and constraints, component masses and connection simplifications. Rigid, elastic or omitted joints represent different assumptions requiring justification. Review frequency applicability when the board, supports or major components change.
Match shape and frequency when comparing revisions rather than assuming that mode 2 in each model is the same deformation pattern. This review method establishes no Hongchuan simulation-service capability or vibration certification.
Keep test evidence separate
Modal results describe dynamic characteristics. Input spectra and measured response need their own records; see PCB jumper random vibration PSD and Grms reporting. A mode plot has no actual exposure duration or test input and cannot replace pre- and post-test acceptance checks.
Questions
Does a colour bar showing mm guarantee actual amplitude? Check analysis type, software interpretation and normalization as well.
Is a higher natural frequency always better? Evaluate it against excitation and design objectives; frequency alone cannot rank all reliability outcomes.
Sources
Autodesk modal analysis training;Ansys PCB natural-frequency example
The cover is an AI modal concept. Transparent bent outlines are exaggerated illustrations, not measured displacement, a Hongchuan simulation or a failure record.