


For PCB busbar width Gage R&R, verify the study design and denominator before interpreting percentages. %Study Var uses study-variation ratios based on standard deviations; %Contribution uses variance components. A suitable repeatability and reproducibility result alone does not establish process capability or absence of measurement bias.
Define one width feature
NIST treats repeatability, reproducibility, stability and bias as distinct measurement-system considerations. For a busbar, identify the cross-section, contact direction and part condition. Do not mix local burr width, deburred width and plated width into one unspecified feature.
For parts that can be remeasured without changing them, a crossed study can have each operator repeatedly measure the same parts. Randomize the sequence and avoid revealing previous readings. Establish sample size, operators and repetitions in the quality plan rather than treating one study layout as universal.
One input can produce two percentages
Minitab defines the standard deviation, variance contribution and study variation separately. Suppose the model estimates σgage=0.010 mm and σtotal=0.040 mm, using the same study multiplier for both. Their standard-deviation ratio is 25%; their variance ratio is 6.25%.
| Field | Illustrative calculation | Result |
|---|---|---|
| %Study Var | 0.010/0.040×100% | 25% |
| %Contribution | 0.0001/0.0016×100% | 6.25% |
| %Tolerance | Study variation/two-sided tolerance width×100% | No tolerance supplied |
These assumed inputs are not Hongchuan study results. Standard deviations use mm; variances use mm². Do not apply a criterion intended for one field to another. Individual %Study Var values are not expected to sum to 100%.
Preserve the study conditions
Keep part IDs, original readings, operators, repeat order, instrument IDs and measurement-location photographs. Record the analysis method, interaction treatment and source of the total-variation estimate. Changing the range of study parts can change the denominator and associated percentages.
Check resolution, calibration status, contact force and positioning. If operators differ, establish whether they measured the same cross-section using the same locating method before selecting training or fixture changes. One study does not replace ongoing stability monitoring.
Connect it to dimensional acceptance
For custom PCB copper busbars, agree on dimensional tolerances, measurement-system evaluation and Cp/Cpk process capability separately. Do not release a batch solely because one Gage R&R percentage looks favorable.
Questions
Does recent calibration replace this study? Calibration and repeated production measurements address different questions.
Does a low percentage prove small absolute error? Also inspect the standard deviation, bias and denominator.
References
NIST gauge R&R framework; Minitab crossed Gage R&R formulas.
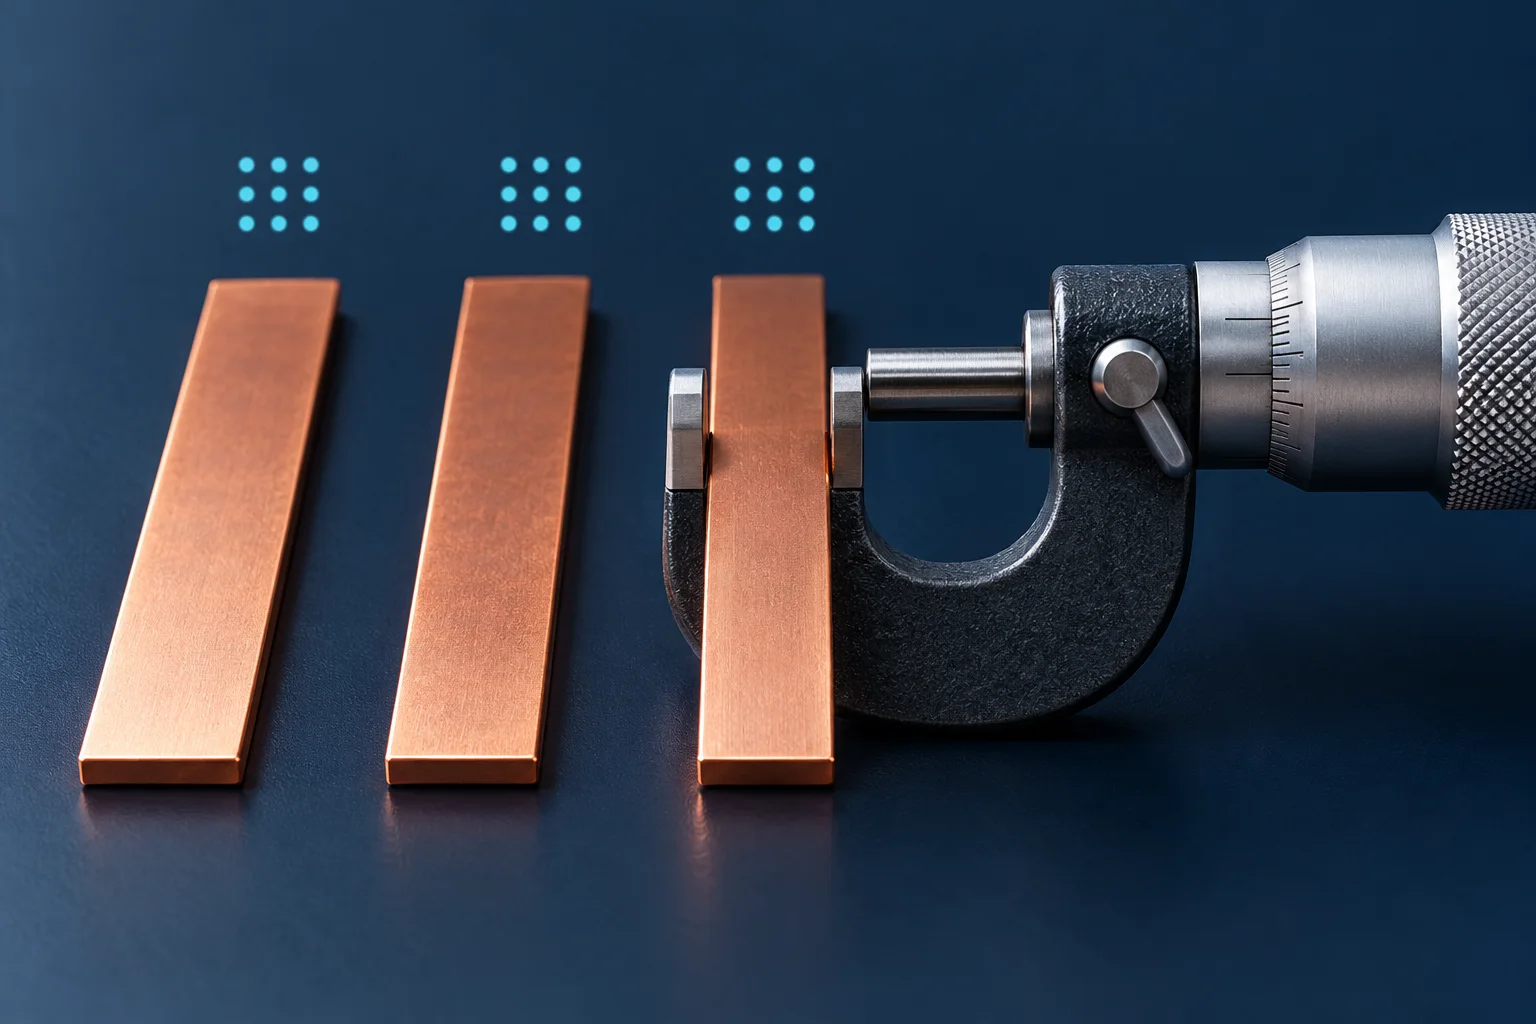
The cover is an AI repeated-measurement illustration, not a Hongchuan study record. Examples establish no capability, measurement-accuracy or acceptance-limit claim.